
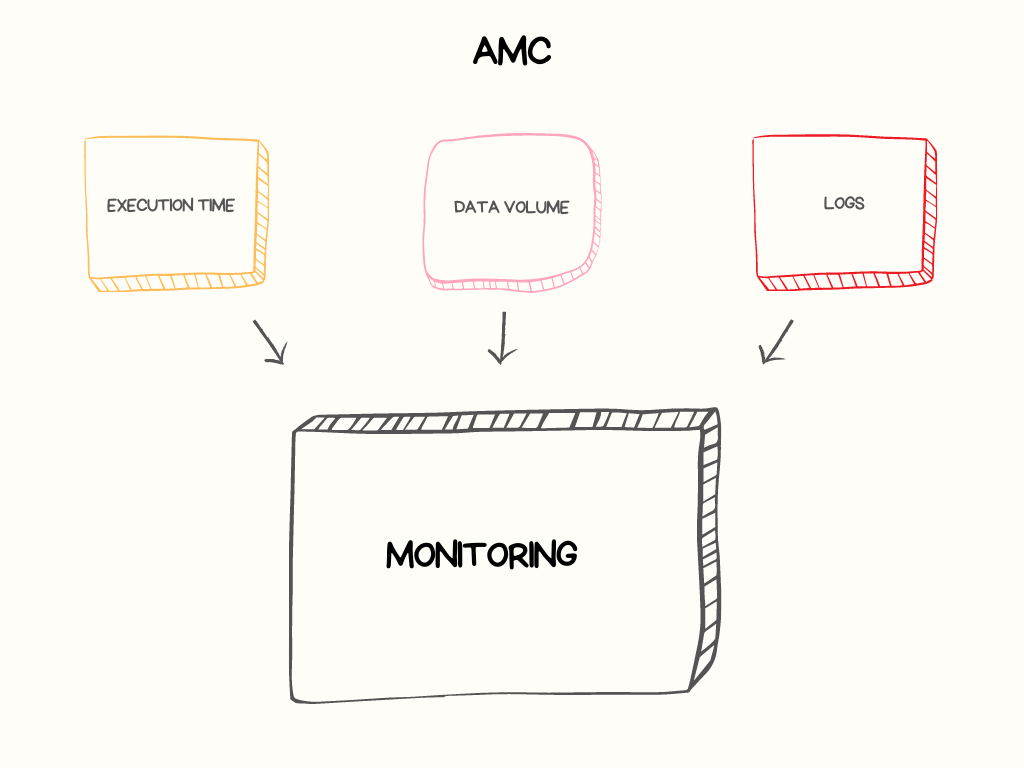
The AMC module allows retrieving information related to:
- Execution time
- Data volume
- Logs
Logs interface
- Logs Filtering by project
- Logs Filtering by job
- Logs Filtering by prefix
- Logs Number of filtered projects and jobs
- Logs Day, month, year
- Logs Scrolling list of projects and jobs
- Logs Creation of the table containing the following information:
project/Job/Status/Duration/Start date/End Date
- Logs Adding the two columns “Component” and “Message” when clicking on a job
- Logs Calculating the minimum and maximum execution time
- Logs Average execution time diagram of jobs per hour
- Logs Average execution time diagram of projects per hour
- Logs Elapsed time diagram per job
- Logs Project execution time evolution graph over time
- Logs Success and failure rate of a job
- Logs Chart of time required by each component
- Logs Job execution time evolution graph over time
Stat interface
- Statistics Filtering by project
- Statistics Filtering by job
- Statistics Filtering by prefix
- Statistics Number of filtered projects and jobs
- Statistics Day, month, year
- Statistics Scrolling list of projects and jobs
- Statistics Creation of the table containing the following information: Project/Job/Status/Context/Version/Duration/Moment
- Statistics Success rate, error rate, and warning rate chart
- Statistics Execution count diagram of jobs by context
- Statistics Execution count diagram of jobs by version
- Statistics tWarn, tDie, and tException rate chart for a project or job
- Statistics Creation of the table containing error messages and their origins
- Statistics Searching for a message
- Statistics Log evolution graph over time
Flow interface
- Flow Filtering by project
- Flow Filtering by job
- Flow Filtering by prefix
- Flow Number of filtered projects and jobs
- Flow Day, month, year
- Flow Scrolling list of projects and jobs
- Flow Creation of the table containing the following information: Date, Origin, Label, Count, Reference, Thresholds
- Flow Volume graph of jobs
- Flow Threshold chart
- Flow Calculation of maximum and minimum processed flow
- Flow Top job/Volume treated diagram
- Flow Top Project/Volume treated diagram
- Flow Flow evolution graph at the job level over time
- Flow Calculation of maximum, minimum, and average processed flow for job and/or project
- Flow Chart of processed flow by each component
- Flow Flow evolution graph at the project level over time
Memory interface
- Memory graph showing memory consumption per job.